Planbor

Your aggregated data,
always in front of your eyes

Planbor is a combination of an assistant device and a comprehensive web-system that seamlessly integrates your key information from multiple sources, displaying it in one customizable view

Key Features:

  • πŸ“Š Aggregates data from all your favorite services
  • πŸ”§ Flexible widget system for personalized layouts
  • πŸ”‹ Low-energy, wireless, and portable e-ink device
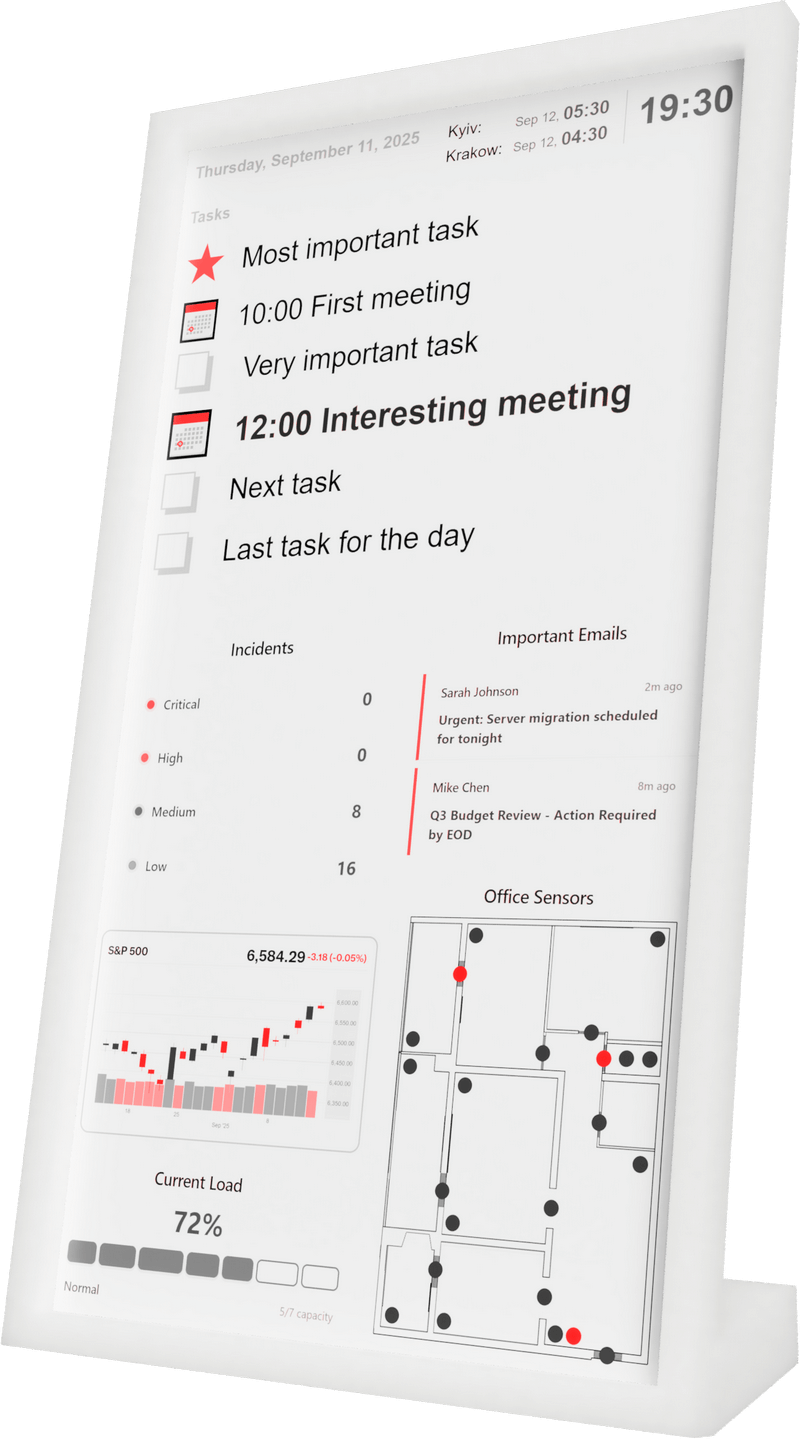
Planbor device

Pain Points That Require Persistent Visibility

The cognitive load of remembering to check: Every productivity system requires you to remember it exists. Remember to check tasks. Remember to open calendar. Remember to look at metrics. This mental effort is the first point of failure β€” if you forget to look, the system fails before it starts.

Procrastination through task invisibility: You close your todo app and tasks cease to exist. An few hours later you remember something was important. Open it β€” missed deadline. The brain doesn't hold in working memory what it doesn't see.

Deep work equals missed meetings: Coding, writing, designing. Flow state. The meeting started 10 minutes ago. Calendar was open in the morning, notification came, but you didn't notice. Need a passive indicator in peripheral vision, not on the work screen.

Manual updates of physical media: Any paper with daily plan becomes obsolete after the first calendar change. Team whiteboard requires someone to update it. Price tags, info signs, directories β€” all require manual work with every change.

Fragmentation of critical metrics: Servers in Grafana, sales in CRM, tasks in Jira, calendar in Outlook. To understand status, need to open 5 tabs. Want to just glance and know β€” is everything ok?

Context outside primary workspace: Kitchen, hallway, workshop, warehouse - places where you need information but no computer. And carrying phone and remembering to check β€” that doesn't work.

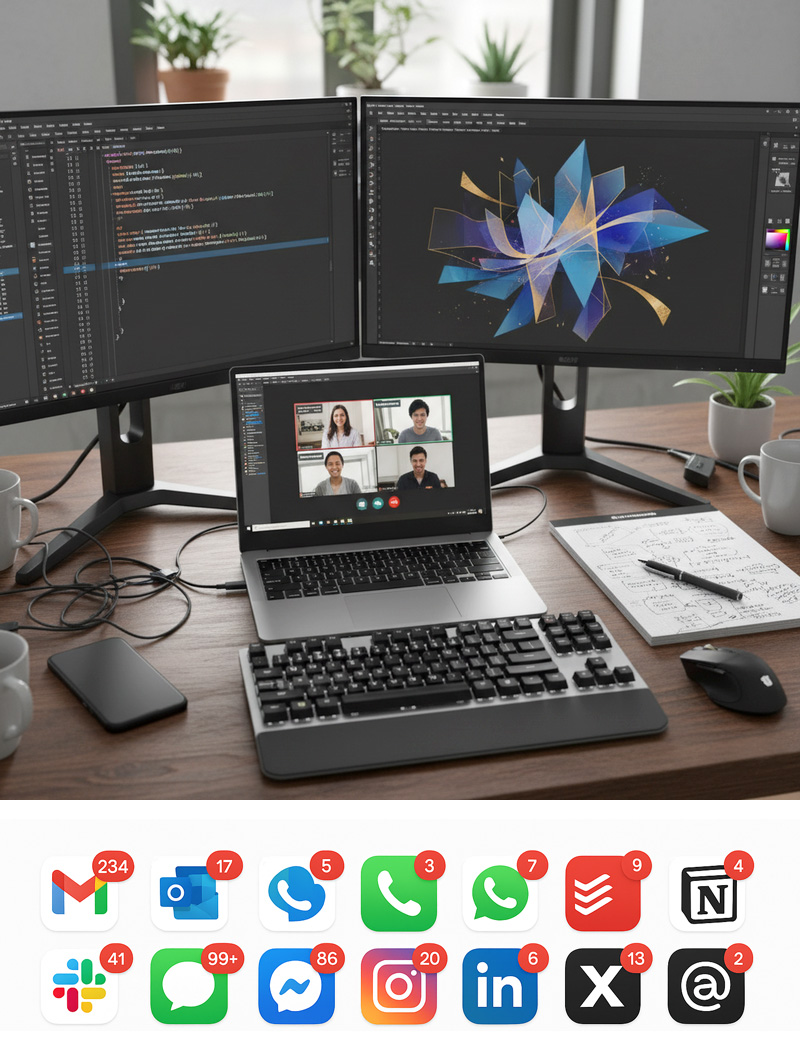
Workspace lacking visual reminders
No visual reminder β€” missed opportunities

The Planbor Solution

The platform aggregates disparate data streams from different sources and merges them on a single screen through a flexible widget system. The standalone e-ink display in your field of vision doesn't glare, doesn't turn off, and always shows current data. Planbor is designed as an ecosystem where every part can grow dynamically through development of small independent modules. Such a system can solve a very broad range of tasks, helping people not lose information.

Simple as 1-2-3:

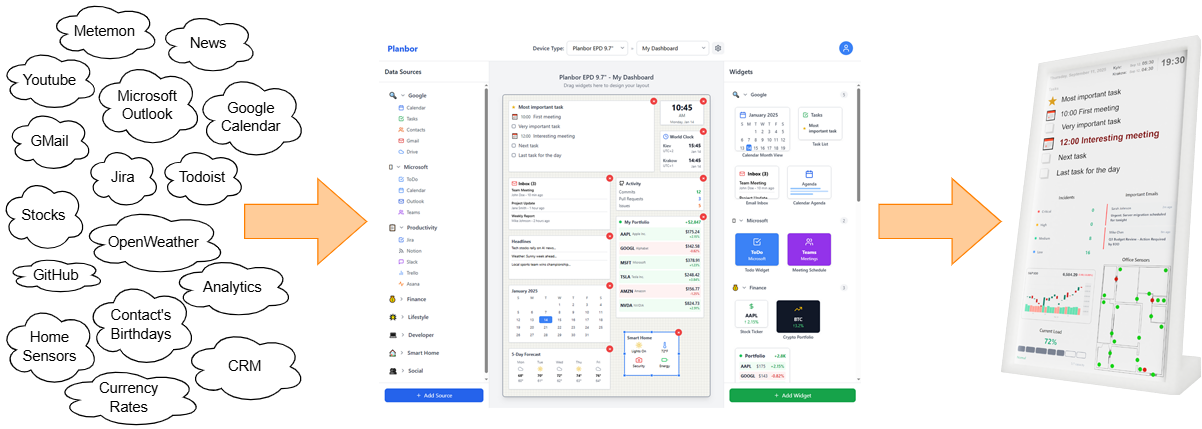
Connect your servicesΒ β†’ Configure your layoutΒ β†’ Place and enjoy
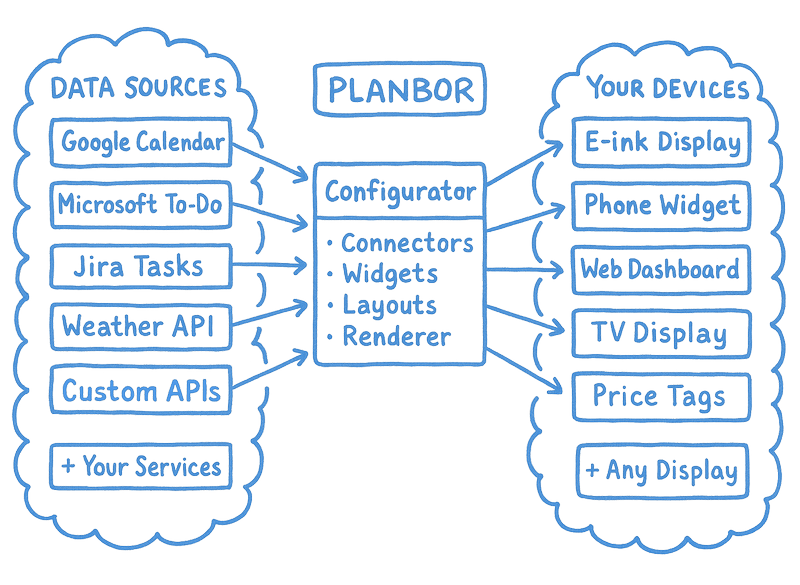
Diagram showing Planbor data flow

Why It Works

Always visible β€” no cognitive load
Information stays in sight without any effort to remember checking

Physical presence drives action
Tasks you constantly see get done β€” visibility creates accountability

Peripheral awareness without interruption
Changes catch your eye while working β€” no context switching needed

Instant sync across all devices
Update anywhere, see everywhere in seconds

Scalable ecosystem, not just a display
From one desk screen to thousands of price tags β€” same platform, infinite applications

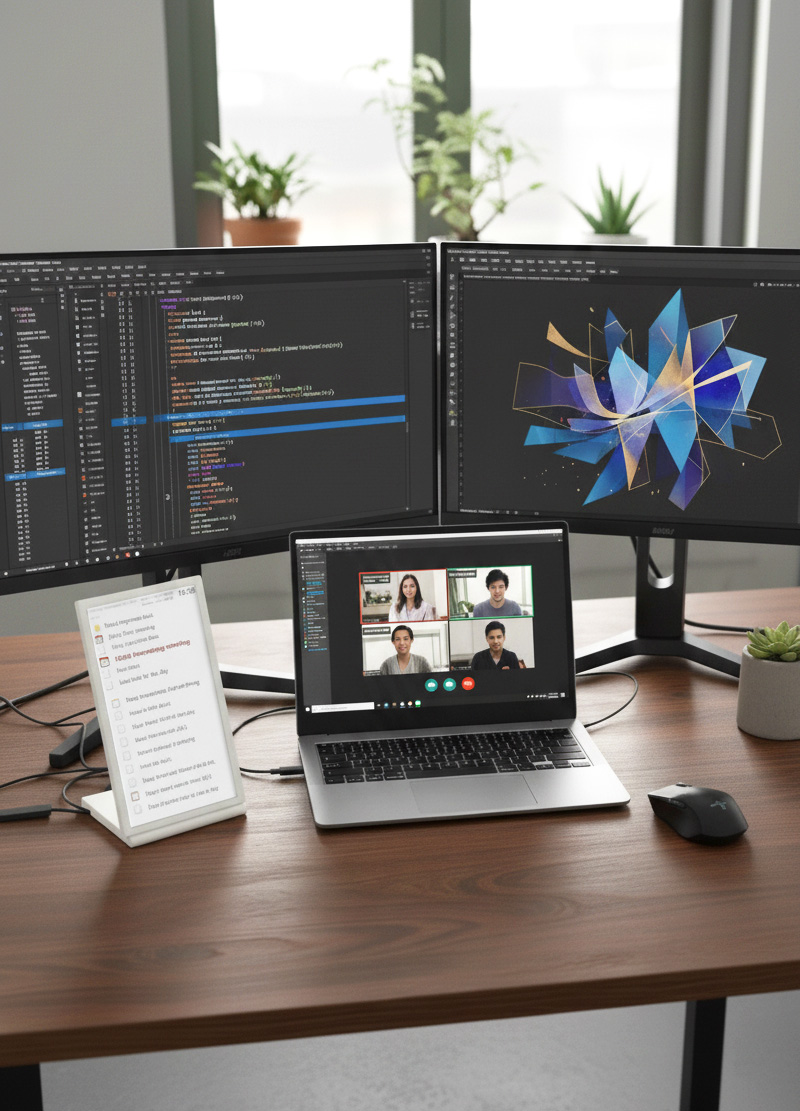
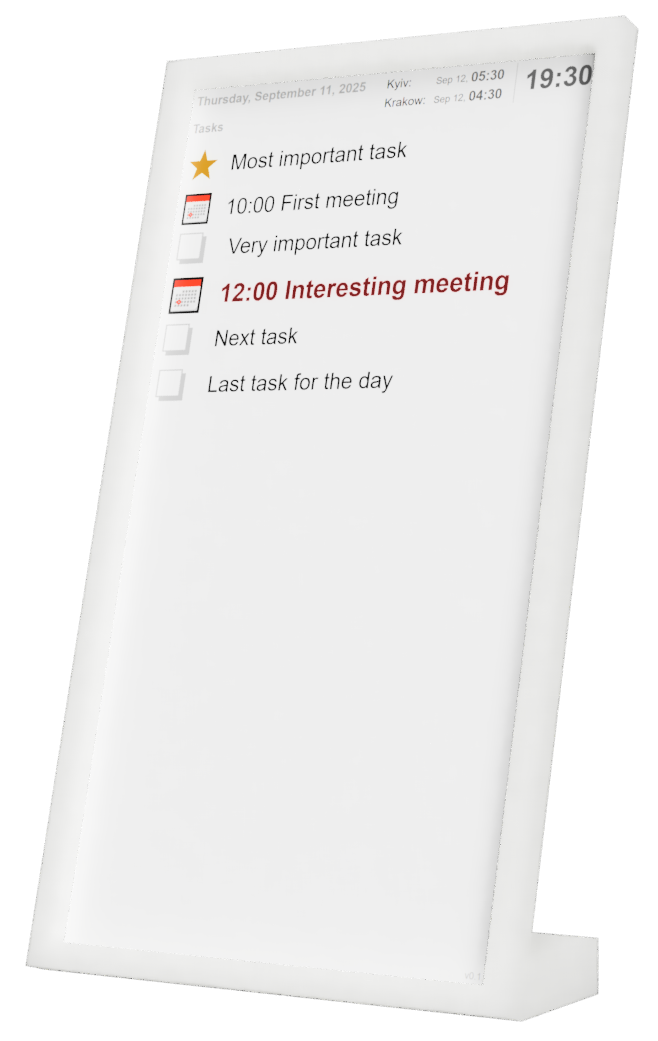
Desk setup with Planbor display
Replaces manual boards with a live e-ink view

How it works

From chaos to clarity through intelligent data pipeline

Planbor isn't just another dashboard β€” it's a complete ecosystem that transforms how data flows from sources to screens.

Three-layer architecture:

Source Layer: Connectors authenticate and collect raw streams from any API, parser, or IoT device, tagging each with metadata

Processing Layer: Configurator processes, caches, and combines data through widgets. Builder transforms configurations into optimized datasets for each device type

Presentation Layer: Renderers generate perfect output for each display: PNG for e-ink, HTML for browsers, signals for IoT, anything for anywhere

Key principles:

  • Event-driven updates: Data changes trigger instant actions, not just scheduled refreshes
  • Modular ecosystem: Every component (connector, widget, renderer) is an independent module
  • Multi-target rendering: One configuration, infinite display possibilities
  • Offline-first caching: Smart data retention ensures displays work even when sources are down

The magic: you configure once, Planbor handles the complexity of making it work everywhere.

Planbor architecture concept
Main concept

Data Sources β€”
The Input Layer

Turn anything into a data stream

Connectors are the bridge between the world's data and the Planbor System. Each connector is a specialized module that knows how to speak with its source. Everything that can be turned into a data stream can be connected through it.

Universal compatibility:

  • APIs: REST, GraphQL, WebSockets, any protocol
  • Services: Google, Microsoft, Atlassian, and 100+ integrations
  • IoT devices: Temperature sensors, smart home, industrial equipment
  • Parsers: Websites, documents, legacy systems
  • Manual input: Forms, spreadsheets, direct updates

Smart data handling:

  • Authentication management: OAuth, API keys, certificates stored securely
  • Push & Pull modes: Subscribe to webhooks or poll on schedule
  • Data tagging: Each stream marked with connector name, type, source, and meta to filter later
  • Intelligent caching: Know what's fresh, what's stale, what's critical
  • Error resilience: Fallbacks, retries, graceful degradation

Ecosystem approach:

Connectors are independent modules β€” public or private. Each connector does one thing well β€” talks to one source. Anyone can create and share connectors. The platform grows itself.

Example: Three weather connectors (OpenWeather, Weather.gov, AccuWeather) each fetch their data independently. Your widget combines them, compares forecasts, and shows the most reliable prediction β€” that's the power of separation.

Configurator β€”
The Brain

Visual power meets developer flexibility

The Configurator is where data becomes information. It's not just arranging widgets β€” it's orchestrating data flows, defining logic, and creating intelligence.

Widget System:

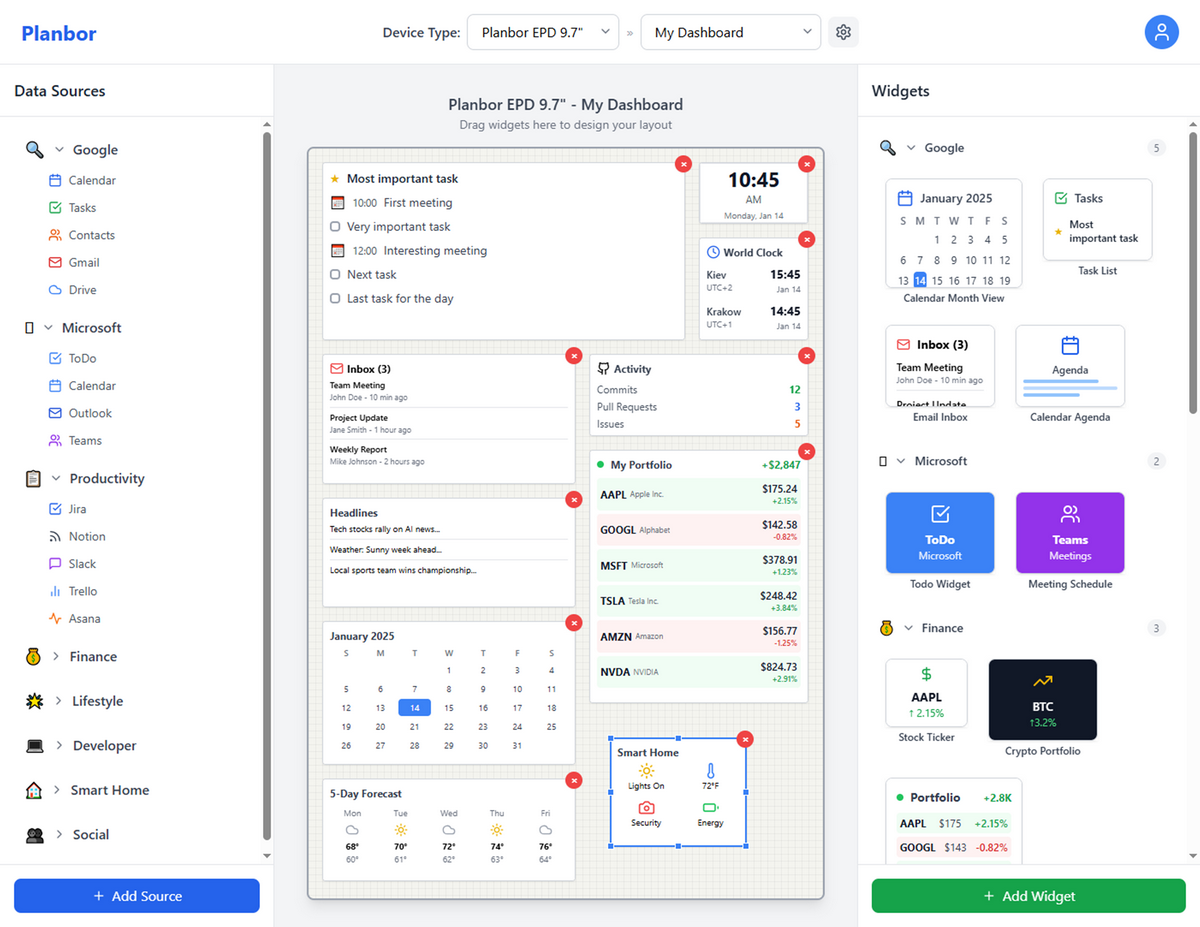
  • Drag-and-drop interface: Position, resize, layer widgets like building blocks
  • Smart data selection: Widgets define masks to filter data by type, source, or connector
  • Flexible data processing: Query data with jq-like paths or process manually
  • Universal aggregation: Merge multiple calendars, compare weather sources, combine any data streams
  • Open output format: Widget generates whatever the device needs β€” templates, commands or signals (via special renderers)

While widgets primarily visualize data, they're actually code executing in data context β€” capable of any appropriate action: triggering automation, sending notifications, controlling devices, or computing complex analytics. The only limit is imagination.

Layout Management:

  • Real-time preview: See changes with actual data before deploying
  • Unlimited layouts: Create different views for different contexts
  • Device-specific optimization: Each layout is designed for specific screen type and size
  • Schedule switching: Automatically change layouts by time or events
  • Import/export: Share configurations with others

Example: Temperature sensor reports < 15Β°C β†’ heating widget processes data β†’ sends "turn on" command to smart thermostat AND updates e-ink display with heating status. One data change, multiple automated actions.

The Configurator makes complex things simple and simple things instant.

Configurator: drag-and-drop widgets with live preview

Output Devices β€”
Display Everything

One configuration, infinite displays

Devices aren't just screens β€” they're any endpoint that needs your data. Planbor's renderer system ensures perfect presentation everywhere.

Device Types:

  • E-ink displays: Our flagship hardware, and other devices
  • Smart TVs: Conference rooms, waiting areas
  • Browsers: Live dashboards, public displays, kiosks
  • Smart home: Thermostats, lights, locks, any connected device
  • Digital signage: Price tags, menu boards, info displays
  • Industrial IoT: Sensors, controllers, monitoring systems

Renderer System.

Different renderers optimize output for device categories:

  • Bitmap renderer: Generates images for e-ink displays of various sizes
  • Web renderer: Creates responsive HTML with real-time updates
  • Data renderer: Sends JSON/XML to third-party systems
  • Command renderer: Triggers actions in IoT devices

Smart Features:

  • Format optimization: Each renderer knows what works best for its targets
  • Group management: Update hundreds of devices at once
  • Hardware abstraction: Add any device type with a renderer module

Your Planbor device: 7.8" e-ink, 2-month battery, WiFi, ready to use. But the ecosystem is unlimited.

Planbor Hardware

Standalone e-paper display designed for always-on information

Key parameters:

  • Display: 7.8β€³ e-paper, 1872Γ—1404 px; partial refresh supported; full/partial refresh in <1 s for local zones/widgets.
  • Enclosure: desk or wall-mount form factor for home and office scenarios.
  • Connectivity: Wi-Fi with simple onboarding and account/device linking.
  • E-ink behavior: energy-efficient β€” the image persists without power; no glare; readable in normal ambient light.
  • Frontlight: edge-lit, adjustable brightness and color temperature; off by default.
  • Screen options: 6β€³ / 9.7β€³ / 10.3β€³ / 13.3β€³; mono, three- and four-color, and full-color e-ink variants.

What's on the device:

  • Recessed multi-function button (flush/hidden): short press β€” request refresh; 5 s β€” Wi-Fi onboarding; 10 s β€” factory reset.
  • Discreet status indicator (rear/bottom): blinks only on events (onboarding, update in progress, error).
  • On-screen pairing QR + time-limited code (rotates each 15 minutes)
  • Display panel with thin bezels, optimized for text, schedules, and infographics.

How it's used:

  • Onboarding hotspot: device exposes a temporary access point for first-time WI-Fi setup, device configuration or recovery.
  • Setup: connect to Wi-Fi, scan the QR or enter the code at my.planbor.com to link the device; the device fetches rendered screens from the system.
  • Updates: arrives automatically (time-based, event-driven or scheduled).
  • Orientation & layouts: portrait/landscape; different widget sets can be scheduled for the same device.
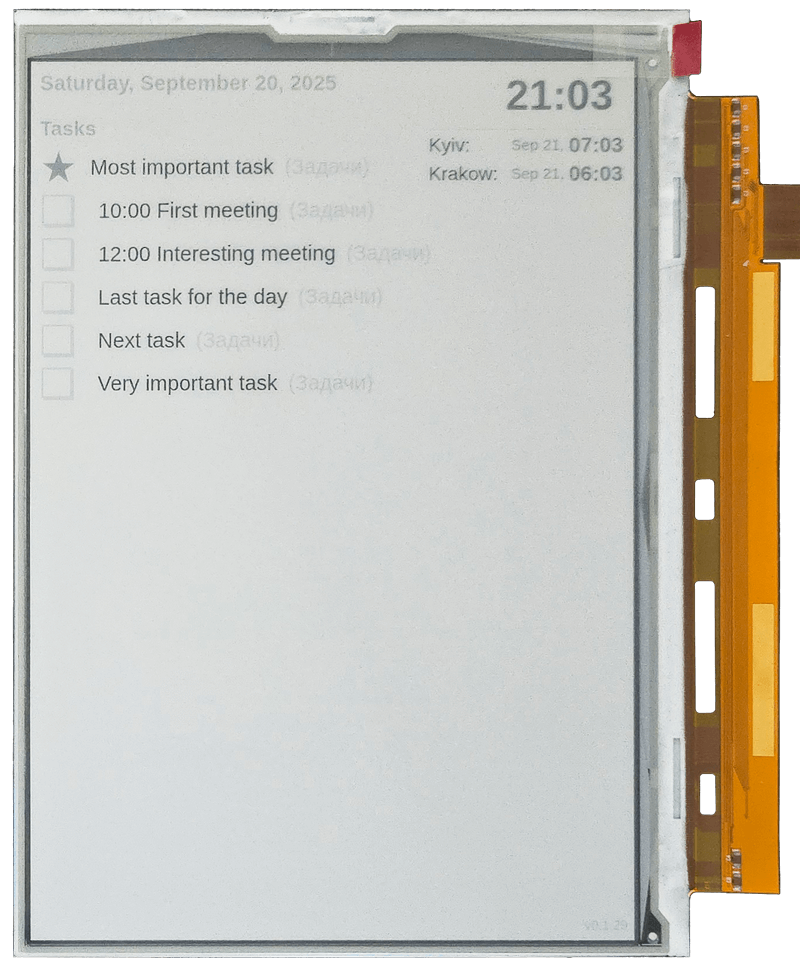
Standalone e-ink screen

Real World Applications

Personal & Home

  • Personal Desk: Tasks and calendar always visible
  • Kitchen Hub: Family calendars and shopping lists
  • Parcel Tracking: Delivery status at a glance

Business & Analytics

  • Google Analytics: Website traffic without opening dashboard
  • YouTube Statistics: Channel performance metrics
  • Shopify Dashboard: Sales and inventory in real-time
  • Market Tickers: Stock prices and crypto rates
  • Kickstarter Campaign: Backer count and funding progress

Office & Retail

  • Team Dashboard: Jira metrics without tab switching
  • Reception Display: Queue and appointment status
  • Conference Rooms: Schedule and availability
  • Retail Price Tags: Dynamic pricing synced with inventory

Fun & Creative

  • Conway's Game of Life: Cellular automaton patterns evolving
  • Art Gallery: Daily masterpiece rotation
  • Word of the Day: Learning new vocabulary passively

One platform, endless possibilities.

Planbor device's screen, PoC stage